


December 2010
Dear Reader,
Bill Bernbach, the “B” of DDB once said, “Any idea can turn to dust or magic, depending on the talent that rubs against it.”
At Versta Research we like to think there is a bit of magic in the work that we do, especially when it comes to the wizardry of numbers and turning data into stories. So in this newsletter we talk about magic in market research, including the real magic of numbers and the not-so-real.
Other items of interest include:
- New Webinar on Sampling for Dummies
- Three Tips to Boost Your Survey Response Rate
- Dogbert’s Approach to Respondent Privacy
- Simple Steps to Actionable Insights
- Killer Quotes from Research Respondents
- Listening to Your Customers through Social Media
- Research without an Audience Is like a Fish without Sunshine
- Sampling for Concept Testing and Innovation
- Eliminate Your Margin of Error
- Statisticians Who Watch Focus Groups
We are also delighted to share with you:
If you need some help understanding the real magic of market research, and are looking for the talent and expertise to avoid research that turns to dust, give us a call. We are eager to show you what we can do, and eager to share our secrets along the way.
Happy Holidays!
Sincerely,
The Versta Team
Magic Numbers in Market Research
“From the time of Kepler to that of Newton, and from Newton to Hartley, not only all things in external nature, but the subtlest mysteries of life and organization, and even of the intellect and moral being, were conjured within the magic circle of mathematical formulae.”
—Samuel Taylor Coleridge
All research, whether qualitative or quantitative, from focus groups to conjoint modeling, relies on a certain kind of number magic—an idea we have borrowed from Daniel Gilbert, who is a professor of psychology at Harvard University. So here’s a quick quiz: Do you know these magic numbers that we see all the time in market research?
- When looking at subgroups within a sample, what is the minimum number of respondents required to detect important differences?
a. 1
b. 10
c. 75
d. 100
e. 125
f. 300 - What is the appropriate confidence level used in determining statistical significance?
a. 51%
b. 90%
c. 95%
d. 99%
e. 100% - What are the optimal number of points to include on a numeric scale for a survey?
a. 4
b. 5
c. 7
d. 10
e. 11
Most of us in the worlds of market research do have answers to these questions. They are our magic numbers. Are there absolutely right answers to these questions? No. Yet the answers we give tend to have a certain magical sway over us whether or not they are completely true. Professor Gilbert explains:
Magic numbers are the familiar ones that have something to do with the way we keep track of time (7, say, and 24) or something to do with the way we count (namely, on 10 fingers). The “time numbers” and the “10 numbers” hold remarkable sway over our lives. We think in these numbers (if you ask people to produce a random number between one and a hundred, their guesses will cluster around the handful that end in zero or five) and we talk in these numbers (we say we will be there in five or 10 minutes, not six or 11).
But these magic numbers don’t just dominate our thoughts and dictate our words; they also drive our most important decisions.
What kinds of decisions? Gilbert gives us many examples. How long should we take antibiotics? At least seven days, despite evidence that three days will do. Which stocks should we buy? Studies show that investors see greater upside for a stock priced at $10.01 than for one priced at $9.99. Gilbert also reminds us of a study reported in the Journal of Consumer Research suggesting that buyers are drawn to prices with vocally small sounds—for example, $2.33, which ends in small-sounding e’s, rather than $2.22, which ends in a large-sounding o.
Market researchers continually see evidence that certain numbers and ideas hold an irrational sway over consumers and decision-makers. What we do not typically acknowledge is that many of our own favorite numbers in research itself are similarly arbitrary. We hang onto them like magic trinkets because they are easy, because they work, and because they are rooted in the fundamental ways we count, track time, or assign meaning to the world.
Returning to the quiz questions posed above, for example, here are some of our market research magic numbers:
Quiz question #1. For many researchers, 100 is a typical minimum sample size needed for an analysis of subgroups. 97 or 104 would do about as well, but these numbers are not nearly as magical given how we count numbers in groups of ten. One client once told us that 125 was actually the magic number, though she didn’t know why. She learned it in business school, and it seemed like a good number.
Quiz question #2. The magic number here is 95%. This is what nearly every market research firm uses as a standard for tests of significance. It means that we’re 95% sure that a measurable difference is not a result of random error from sampling. But what’s so great about being 95% sure? Why don’t we all agree to improve the rigor of our work and use a 97% confidence interval? Occasionally some researchers will use numbers like 90% or 99%, though never numbers like 94% or 87%.
Quiz question #3. With Net Promoter Scores now dominating so much customer satisfaction and loyalty research, 11 has become truly a magic number. This is no surprise given how passionately researchers tend to advocate for or against certain scales over others. We, too, have strongly recommended 11- point scales for many years. What’s so great about 11 points?
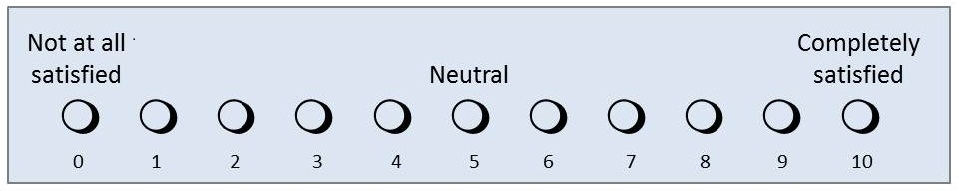
Well, there is a body of research showing that 11-point scales work well among consumers (as do lots of other scales, by the way). But the 11-point numeric scale shown above has three magical properties that keep us returning to it. First, it has a zero endpoint. Zero is a magic number that represents nothingness, and in the world of mathematics zero has quite magical properties unlike other numbers. Second, it has an endpoint labeled 10, which is a magic number tracing its roots to the number of fingers on our hands and hence to the base of our numeric system. Third, it has a midpoint smack dab at the number 5—also a magic number. In fact, these “magical” properties are precisely why the scale works so well. Its three key anchor points are meaningful, “magic” numbers that everyone knows how to use.
Of course there is nothing truly magical about this scale, and there are many situations (for example benchmark or tracking studies), in which using this scale could be disastrous. Nevertheless, we have seen research firms convince clients that their research would magically improve if only they would transition to an 11-point scale, instead of four-, five-, seven-, or nine-point scales.
Know the Math behind the Magic
Why do we at Versta Research care so much about magic numbers? Because market research is full of so-called magic numbers that drive our decisions and guide our work. Some of them really are “magic” (in a way), but most of them are not.
How many people should you include in a focus group? How large a sample is needed for multiple linear regression? What’s the minimum sample size needed for calculations based on normally distributed sample statistics? There are lots of numbers floating around that can serve as good guidelines—numeric rules of thumb that we and others use all the time. But the numbers we use as rules of thumb are not magic. Knowing the extent to which these rules are arbitrary helps remind us that flexibility is key, and that we can adapt the rules to the needs of our clients.
At the same time, there is surely a kind of magic in the mathematical truths that underlie our work. The central limit theorem, the law of large numbers, properties of real numbers and of infinite series—these are the real magic that make sampling, probability, and statistical inference actually work, whether your sample size is 94 or 100, and whether you choose a 95% confidence interval or 87%.
We tell our clients (and often remind ourselves) to forget about most magic numbers bantered about in market research discussions. Focus instead on the math behind the so-called magic. There are no magic sample sizes, margins of error, scale types, tools, technologies, methods, or indexes. There are no magic black boxes that tell you how to optimize your product or service, or that will give you insight. There is only the magic of math, interpretation, problem solving, and expertise behind a thoughtful consideration of how to approach, design, execute and analyze numbers. Know your methods. Know your math. Know how to apply them in the infinite number of ways that problems come up. These are secrets behind the magic that deliver top notch research for your organization.
Stories from the Versta Blog
Here are several recent posts from the Versta Research Blog. Click on any headline to read more.
New Webinar on Sampling for Dummies
Sampling is an easy idea but can quickly get complicated for non-statisticians. We highly recommend this webinar if you want to bone up on the basics.
Three Tips to Boost Your Survey Response Rate
With response rates declining, it is critical to know what the scientific literature says about how to improve them. Here are best practices.
Dogbert’s Approach to Respondent Privacy
Research respondents are critical to market research studies, so protecting their privacy is essential. This article highlights the AAPOR and CASRO guidelines.
Simple Steps to Actionable Insights
No matter what research firms say, most research is not actionable because it is not explicitly designed with a deep understanding of how it will be used.
Killer Quotes from Research Respondents
This article offers strategies and tips for editing verbatim quotes from interviews, focus groups and surveys to create compelling market research reports.
Listening to Your Customers through Social Media
Here is a summary of a round-table discussion, moderated by Versta Research, and published in AMA’s Marketing News about the role of social media in customer satisfaction research.
Research without an Audience Is like a Fish without Sunshine
One reason that research often has no audience is that market research professionals are sometimes isolationists. Deeper engagement between research and marketing through organizations like the AMA is key.
Sampling for Concept Testing and Innovation
Research shows that some consumers are better at developing and providing feedback on new product concepts. Here are the qualities to seek.
Eliminate Your Margin of Error
Versta Research agrees with other industry leaders in the polling industry that published polls should not report a margin of error.
Statisticians Who Watch Focus Groups
Having quantitative researchers participate in the qualitative phases of market research produces the best outcomes, with models that have meaning.
Recently Published
The Art of Asking Questions
One of the best ways to add value to the research that you do is to listen carefully to your internal clients and formulate the right questions. Versta Research outlines a proven process for doing this in an article published in the Fall 2010 issue of Interface magazine, from the Chicago chapter of the American Marketing Association.
Harnessing the Virtual Megaphone
Versta Research moderated a panel of industry thought leaders to discuss the role of social media in customer satisfaction research, with results published in the American Marketing Association’s October 2010 issue of Marketing News.
Versta Research in the News
MORE VERSTA NEWSLETTERS